Web Performance & Optimisation
Being a good Frontend Developer isn’t just about building things that work, it’s about building things that work fast. This article covers the mental models and practical techniques that developers should use.

Core Web Vitals
When you open a website, a lot of things need to happen before you can actually use it. Google came up with a set of metrics called Core Web Vitals to measure exactly how that experience feels to the user, not just whether the page loaded, but whether it loaded fast, stayed stable, and responded quickly.
There are three of these metrics that matter most.
LCP (Largest Contentful Paint)
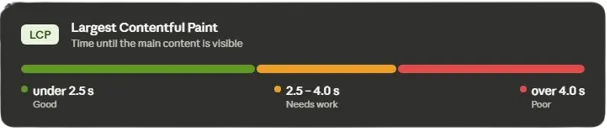
Think about the last time you opened a website and waited for the main image or headline to appear. That moment, when the biggest thing on the page finally shows up, is what LCP measures. It could be a hero image, a large block of text, or a video. The reason Google picked the largest element is that it’s usually what signals to the user “the page is ready.” So LCP is really measuring how fast the page feels loaded, not just when it technically finished in the background.
CLS (Cumulative Layout Shift)
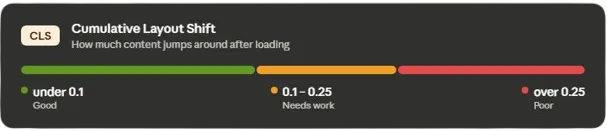
Most of us have already experienced this. Let’s say you’re reading an article, about to click a link, and suddenly an ad loads above it and pushes everything down, which might result in clicking the wrong thing. That shift is what CLS measures, how much visible content moves around after it’s already appeared on screen.
The most common causes are images without defined width and height (the browser doesn’t know how much space to reserve), ads or embeds that load after the page, and fonts that load late and cause text to reflow. Therefore always define dimensions on images and reserve space for anything that loads dynamically.
INP (Interaction to Next Paint)
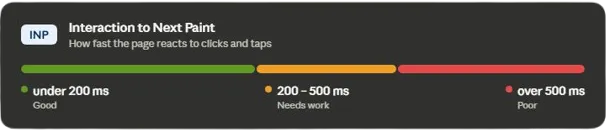
A page can load fast but still feel slow if it doesn’t respond quickly when you click something. INP measures the time between a user interaction like a click or a tap and when the page actually responds to it. If every click takes 500ms to register, that’s an INP problem. This is usually caused by too much JavaScript running on the main thread, blocking everything else.
These three metrics together give you a clear picture of how your page actually feels to use, not just how fast it loads, but how stable and responsive it is throughout the entire experience.
The Critical Rendering Path
Before you can optimise a page, you need to understand what the browser actually does when it loads one.

When you hit enter on a URL, the browser fetches the HTML, parses it into the DOM, fetches and parses CSS into the CSSOM, executes JavaScript it encounters, builds the render tree, calculates layout, and paints pixels. That sequence is the Critical Rendering Path, and certain things block it from completing, meaning nothing appears on screen until they’re done:
- CSS in the head tag is render-blocking: the browser needs the full CSSOM before it can build the render tree, so it waits for all CSS to download and process.
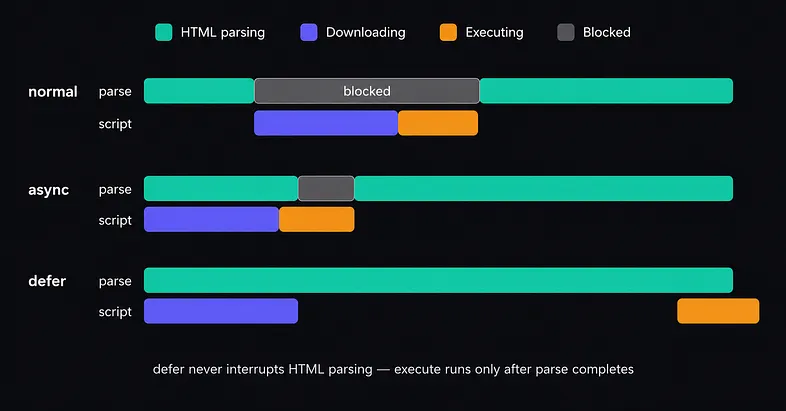
- Synchronous JavaScript in the head tag stops HTML parsing entirely while the script downloads and executes. A 2-second script download means 2 seconds of blank page.
This is why you see advice like “put scripts at the bottom of the body” or “use defer and async.” defer downloads the script in parallel and only executes it after HTML parsing is complete, safe and ordered. async also downloads in parallel but executes the moment it's ready, which can still interrupt parsing. Use defer for scripts that depend on the DOM, async for independent scripts like analytics.
The 5 Step Performance Formula
When you’re handed a slow page, don’t guess, measure first, then fix in this order, it goes from highest impact to lowest.
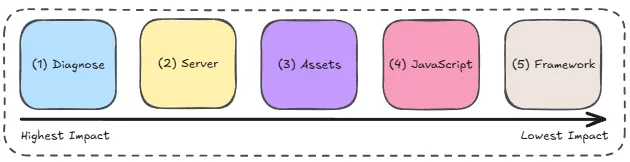
1. Diagnose first
Use Lighthouse in Chrome DevTools to get a performance score and identify what’s causing the slowdown. Use Chrome Performance Insights for a more detailed breakdown of exactly what’s happening during page load, how long each step takes, which scripts are blocking rendering, which images are too large.
Lighthouse runs in a controlled environment on your machine, so it’s useful during development but it doesn’t tell you what real users are actually experiencing. For that you need Real User Monitoring tools like Sentry, which collect performance data from actual users in production, on their devices, on their networks, in their countries.
2. Optimise the server
The highest impact changes are often server-side, and they don’t require touching your application code at all.
HTTP Caching tell the browser to store static assets locally via Cache-Control headers (e.g. max-age), so returning visitors reuse what they already have instead of re-downloading. Pair this with versioned filenames (cache-busting) so updated assets aren't served stale.
HTTP Compression compresses assets before they leave the server. CSS and JavaScript files can be up to 75% smaller with gzip or Brotli compression.
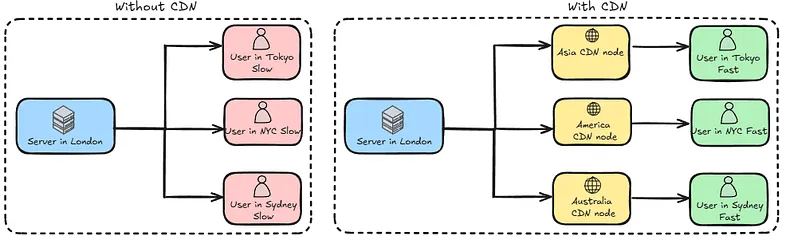
A CDN (Content Delivery Network) solves a geographical problem. If your server is hosted in London, but a user in Tokyo makes a request, that data has to travel across the entire world which takes time. A CDN distributes your static assets to servers around the globe, so that user in Tokyo gets served from the nearest CDN server to them rather than from London. CDNs also apply caching and compression automatically.
Resource hints: dns-prefetch resolves a domain's DNS ahead of time, a cheap way to shave latency off a future request while preconnect does more: DNS plus the TCP handshake plus TLS negotiation, so the connection is fully ready before it's needed. This is more effective, but more expensive per connection, so reserve it for your 1–3 most critical third-party origins and use dns-prefetch for the rest.
preload fetches something critical (a hero image, a font) before the browser would normally discover it. prefetch fetches something the user will likely need on the next page, using idle time:
<link rel="preload" href="/fonts/inter.woff2" as="font" crossorigin>
<link rel="prefetch" href="/checkout.js">
3. Optimise static assets
Images, CSS and fonts are usually the heaviest assets on a page and the easiest to optimise.
For images:
- Use WebP format (significantly smaller than JPEG or PNG with similar quality)
- Always define width and height to prevent layout shifts
- Serve images at the right size for where they’re displayed
- Lazy load anything that’s below the fold so it doesn’t block the initial load.
For CSS:
- Minify it to strip out whitespace and comments
- Extract Critical CSS (the CSS needed to render what the user sees above the fold without scrolling)
- Inline that directly in the HTML so the browser doesn’t need to make a separate request for it before rendering.
For fonts:
- Host them on your own server rather than loading from Google Fonts or another third party, as that eliminates an extra network request.
- Use the woff2 format which is the most compressed, and apply caching so returning users don’t re-download them.
4. Optimise JavaScript
JavaScript is the most expensive asset on the web, as it has to be downloaded, parsed, compiled, and executed before it does anything.
Start by cutting anything unused from your bundle such as unused packages, libraries you could replace with a few lines of vanilla JS. Then minify, which your bundler handles this automatically in production.
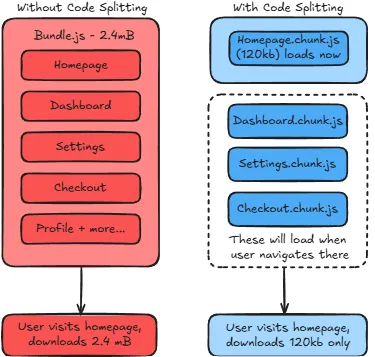
The real gains come from code splitting where instead of one giant bundle for every page and feature, split into chunks that load only when needed. There’s no reason to load checkout code for someone browsing the homepage:
// Without code splitting — loads everything upfront
import CheckoutPage from './CheckoutPage'

// With code splitting — only loads when the user navigates there
const CheckoutPage = React.lazy(() => import('./CheckoutPage'))
This connects to what Webpack does under the hood, things like tree shaking which removes code that’s never imported, code splitting which breaks the rest into on-demand chunks. Together they keep your initial bundle as lean as possible.
5. Framework-specific optimisations
In React, when a parent component re-renders, all its children re-render too by default. In small apps that’s fine, however in large apps with complex component trees, it adds up fast.
The first thing to look at is where your state lives. A state change high up in the tree triggers re-renders all the way down. If only one child actually needs that state, keep it there, don’t lift it higher than necessary.
Beyond that, React gives you three tools:
React.memoskips re-rendering a component if its props haven't changed.useMemocaches an expensive calculation's result between renders, only recalculating when its dependencies change.useCallbacksame idea, for function references, so a new function isn't created (and passed down, triggering child re-renders) on every render.
Don’t reach for these by default, as they add complexity and overhead of their own. Use them once you’ve actually measured a re-render problem, not before.
PS: This is based on my own research and notes. I always recommend checking other resources if you want to go deeper. I wrote this mostly for myself, but if it helps someone else along the way, that’s a win. Thanks for reading.